Visualization Of YouTube Dataset
This project visualizes the Dataset for "Statistics and Social Network of YouTube Videos" available at Simon Fraser University. We implement a set of linked and interactive visualizations referring to the paper GPLOM: The Generalized Plot Matrix for Visualizing Multidimensional Multivariate Data. Our goal is to provide users with a web interface and allow them to explore the data through it. For example, users can find out what the top 3 most frequently viewed categories are or what kinds of videos are most highly rated.
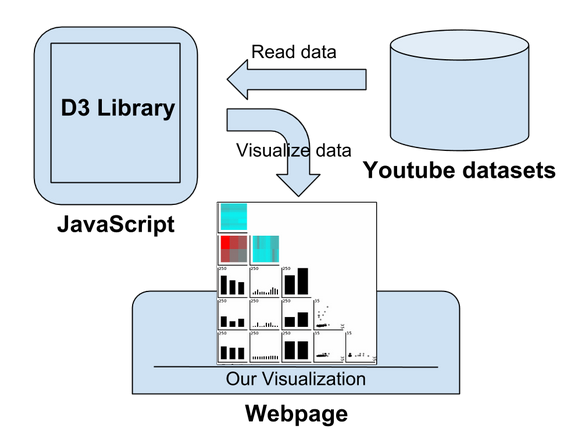
Figure 1. Design Overview
The overall structure of this visualization project consists simply of three components: this website, the dataset, and JavaScript libraries. As figure 1 shows, we first read data from the dataset and visualize it using D3.js. GPLOM is used as a visualization technique. It is a variant of scatterplot matrices and consists of a scatterplot, barchart, and heatmap. Each one deals with different combinations of features in the dataset, as follows:
Heatmap: two categorical features
Scatterplot: two numerical features
Barchart numerical and categorical features.